View our full U.S. Capital Markets coverage from 2018 Insights.
The Dow Jones industrial average reached four 1,000-point milestones in 2017 — the most in any one year — topping out at over 24,000 in December 2017. The S&P 500 and Nasdaq composite also set all-time highs. The gains were driven largely by strong corporate earnings and a favorable macroeconomic backdrop of moderate but steady gross domestic product growth, low unemployment, a strong housing market, high consumer confidence, and the expected pro-business and anti-regulation agenda of the new administration, including the promise of tax reform.
Despite a favorable backdrop of rising equity markets and historically low volatility, the initial public offerings (IPO) market fell short of some expectations going into the year. Many companies chose to take advantage of the robust private markets that have developed in recent years to satisfy their capital-raising and secondary liquidity needs or to pursue an M&A exit (with secondary buyouts by private equity sponsors continuing to make up a large share of M&A activity). With 167 IPOs raising approximately $39 billion, it was a significant improvement over 2016 but still below post-financial crisis highs.
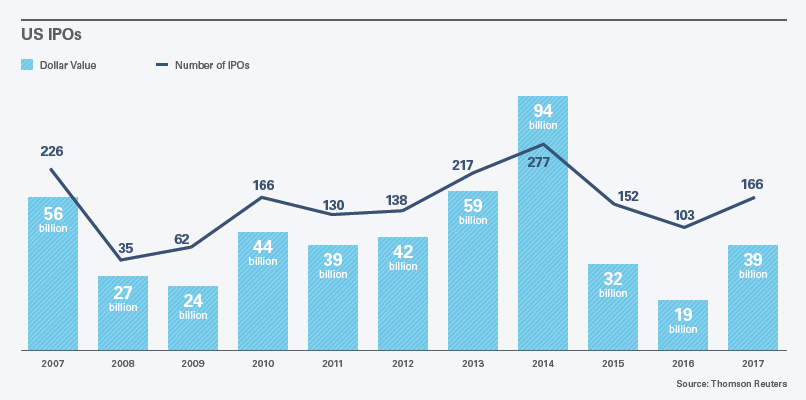
The leading sector for IPOs by volume and number of deals in 2017 was financial services, followed by health care and technology. The two largest IPOs of the year were Snapchat owner Snap Inc. and cable operator Altice USA Inc., which raised $3.91 billion and $2.15 billion, respectively. Despite a solid year, with 27 deals raising $9.1 billion, technology IPOs failed to materialize in the way that some had anticipated. Two of the largest tech IPOs — Snap and Blue Apron — fell short of investor expectations, although a number of subsequent deals — including Roku and Stitch Fix — performed well. Blank check, or special purpose acquisition company (SPAC), issuances increased sharply in 2017, with 29 SPAC IPOs raising a record $8.6 billion (up from 14 SPAC IPOs raising $1.7 billion in 2016).
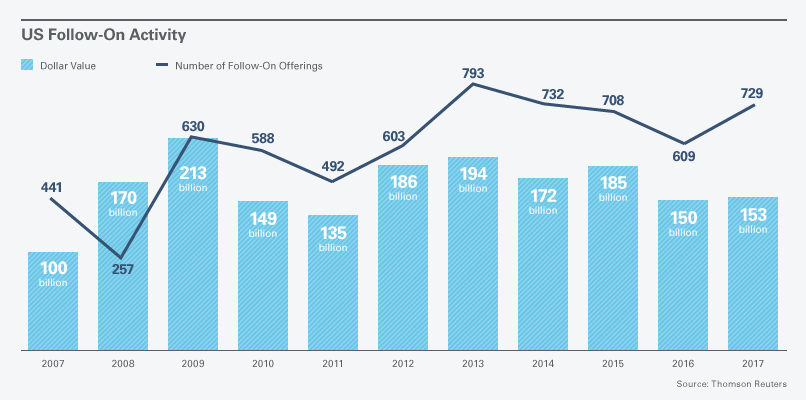
Follow-on activity was relatively flat, with the number of deals up nearly 20 percent — from 609 in 2016 to 730 in 2017 — but the aggregate volume up only 3 percent — from $150.2 billion in 2016 to $154.3 billion in 2017 — reflecting a smaller average deal size. M&A activity continued to drive follow-on activity, as 18 percent of all follow-on volume raised in 2017 was used to fund M&A. Block trades declined as a proportion of overall follow-on activity, representing 30 percent of total follow-on offerings in 2017, more in line with recent years and down from a record high of 49 percent in 2016.
This memorandum is provided by Skadden, Arps, Slate, Meagher & Flom LLP and its affiliates for educational and informational purposes only and is not intended and should not be construed as legal advice. This memorandum is considered advertising under applicable state laws.