View our full U.S. Capital Markets coverage from 2019 Insights.
After a volatile start to the year, the Dow Jones Industrial Average, S&P 500 and Nasdaq composite achieved record highs in the third quarter of 2018, driven by a strong economic backdrop and solid corporate earnings (fueled in part by the impact of tax reform, which led to a record $1 trillion of stock buybacks that boosted earnings per share). Fourth-quarter volatility, however, erased the year’s gains, and the three indices ended the year down 5.6 percent, 6.2 percent and 3.9 percent, respectively, from 2017, their worst annual performance in 10 years. Volatility soared in the fourth quarter, driven by concerns over slowing global economic growth, rising interest rates, U.S.-China trade tensions and policy uncertainty arising from White House communications.
Strong markets in the first three quarters helped make 2018 the best year for U.S. IPOs since 2014, with 199 IPOs raising $51 billion. IPO volume was 31 percent higher than 2017 and 168 percent higher than 2016. While aftermarket performance was mixed, overall, IPOs significantly outperformed broader market indices.
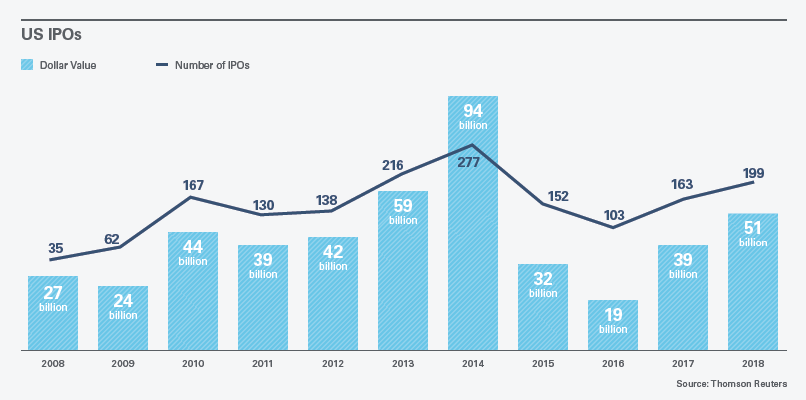
The leading sector for IPOs by volume in 2018 was technology, with a number of tech unicorns completing highly anticipated IPOs. Other top sectors were health care and consumer products and services. Special purpose acquisition companies continued to constitute a significant amount of IPO volume, with 43 deals, representing 19 percent of total IPO proceeds. In 2018, 33 China-based companies completed IPOs, raising $9.2 billion, a 140 percent increase over 2017. In addition, music-streaming service provider Spotify garnered significant attention when it went public in April 2018 by means of an unconventional direct listing, potentially leading the way for a select few others to follow suit. (For example, messaging platform service provider Slack has discussed a possible direct listing.) Companies also continued to take advantage of recent Securities and Exchange Commission (SEC) accommodations, such as the ability for all issuers to confidentially submit draft registration statements and omit certain financial statements previously required for interim drafts. (See “SEC Continues Steady Progress With Regulatory, Enforcement Goals.” See also “New HKEx Rules Spur Bumper Year in Hong Kong Capital Markets, but Lasting Impact Remains Unclear.”)
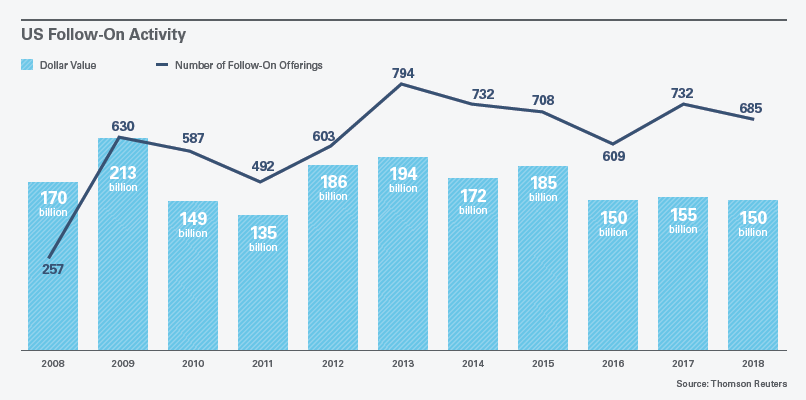
Follow-on activity was relatively flat, both by dollar volume and number of deals. Block trades represented 28 percent of total follow-on offerings, down slightly from 30 percent in 2017 and down significantly from a record 49 percent in 2016. The decline in block trades is attributed largely to weaker aftermarket performance resulting from tighter discounts to market price relative to marketed follow-ons.
This memorandum is provided by Skadden, Arps, Slate, Meagher & Flom LLP and its affiliates for educational and informational purposes only and is not intended and should not be construed as legal advice. This memorandum is considered advertising under applicable state laws.